EVALUATING LLM PERFORMANCE ON SPECIALIZED TASKS
METRIC EVALUATION BEST PRACTICES
INTRODUCTION: THE LLM OPTIMIZATION PARADIGM
"What gets measured gets mastered." - adage
This data science adage has never been more relevant than in the era of Large Language Models (LLMs). This report outlines how to approach LLM evaluation, covering everything from initial exploratory assessments to sophisticated performance metrics that drive systematic optimization across prompting, synthetic data generation, and fine-tuning stages. Only in understanding the measurement, can we have confidence in our application of these powerful yet complex language systems.
Unlike traditional machine learning where success depends on carefully engineering features for specific tasks, LLMs represent a paradigm shift in how we approach evaluation and optimization. These deep neural networks automatically extract and learn relevant features from massive datasets, developing general capabilities that transfer across domains without task-specific training. This emergent property—where models demonstrate reasonable performance on diverse tasks "out of the box"—creates both opportunities and challenges for measuring and enhancing single task performance. The challenge lies in developing appropriate metrics that capture not just accuracy, but nuanced aspects of language understanding, reasoning, and task-specific utility [1, 2]. Without robust evaluation frameworks, we risk being deceived and optimizing for the wrong objectives or missing critical failure modes.
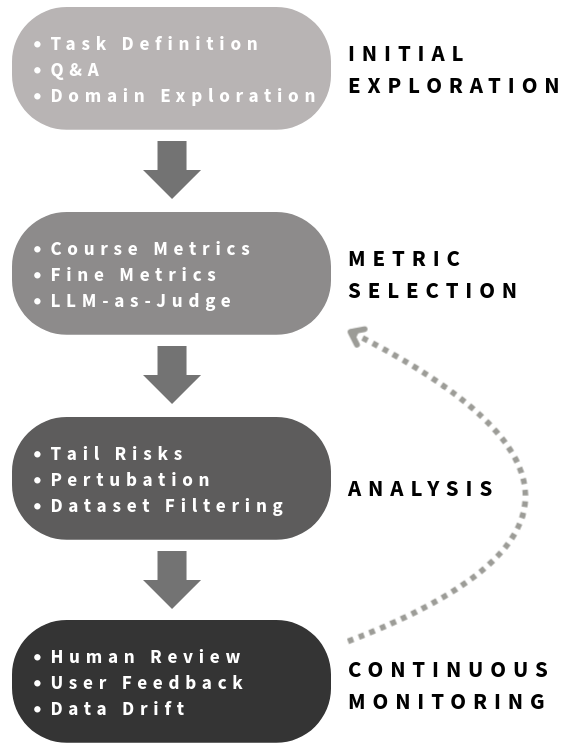
PHASE 1: INITIAL EXPLORATION AND "VIBE CHECK"
"Simpler is smarter" - adage
Before embarking on any optimization or pipeline, and as a general best practice when working with LLMs, perform a "vibe check." Interview the models. See how well it answers questions related to your specific task. This initial hands-on interaction serves several crucial purposes:
Key Benefits
Task Refinement: It forces one to clearly articulate the task, know the inputs and closely examine the outputs. Almost always, preconceived ideas about the task change at this stage.
Manual Prompt Tuning: Plan on iterating through at least 10 examples, manually refining the prompt yourself. This develops intuition about what works and what doesn't, and will serve as a jumping off point to start optimizing.
Understanding Nuances: Grasp the subtleties of your task, anticipate the kind of data you'll need, and identify the types of metrics that will be valuable for scoring performance.
Essentially, this initial phase helps you internalize the new mantra for the age of LLMs: replacing "know your data" with "know your task." (but still know your data)
PHASE 2: ESTABLISHING EVALUATION METRICS
"You can't improve what you don't measure." - adage
As we move from initial exploration to systematic optimization of the task, robust metrics become essential. There are a few standard metrics in evaluating these NLP models (as noted in table 1), these can be combined and built upon. Multiple frameworks also exist to assist like DSPy [3], Comet and LangSmith, they are powerful and help get started quickly, but still require an understanding on how to evaluate the task [1]. The metrics chosen in these frameworks will identify weaknesses and guide improvements.
The metrics can be a second order optimization problem, one on top of optimizing for your task. They will evolve, adapt, and it is crucial they can be tuned [1, 4]. This happens 1) because new information is gathered, or the metric is not capturing all the dimensions of the task, and 2) the chosen metric is not sensitive enough and not providing enough signal. But like in Phase 1 "Simpler is smarter" and the important thing is to start somewhere and iterate.
A multi-faceted evaluation approach, combining computationally efficient traditional metrics with more complex evaluators, can balance efficiency and fidelity (and cost) [5]. By layering simple quantitative measures with more nuanced qualitative assessments, we can create an evaluation system that captures both surface-level performance and deeper aspects of model capability. Balancing multiple measurements ensures efforts target genuine improvements rather than metric-gaming behaviours [1].
Initially, the same set of metrics might be used across different optimization stages (baseline evaluation, prompt optimization, synthetic data generation, fine-tuning, multi-hop systems). However, finer-grained scoring might be necessary depending on the task and stage [6].
Types of Evaluation Metrics
| Metric Category | Description | Examples | Drawbacks |
|---|---|---|---|
| Coarse-Grained Traditional | Performs an initial, surface-level analysis. Computationally simple and allows for rapid scoring. [1, 7] | Accuracy, Precision, Token F1, binary pass/fail | While fast, they often fail to gauge coherence, factual correctness, or nuanced quality. |
| Fine-Grained Traditional | Provides more detailed textual analysis, often comparing generated text to reference(s). [8] | ROUGE, Perplexity, BLEU, BERTSCORE | Most require high-quality reference texts, which can be costly and may not capture all valid outputs. |
| Expert Ranking (LLM-as-a-Judge) | Provides a more holistic assessment that can correlate better with human judgment and downstream task performance. [5] | LLM-as-a-Judge evaluation protocols | Slow and computationally expensive; susceptible to biases; requires careful prompt engineering. |
Task-Specific Metric Selection
A single metric rarely tells the whole story. Combining metrics into a composite score, weighted according to task priorities, often provides the best signal for optimization. But, of course "simpler is smarter". The following are some task specific considerations [1]:
Summarization [7, 8, 9]: Blend faithfulness (ROUGE, BERTSCORE), conciseness (length checks), and coherence (LLM-judge assessment).
Classification/Categorization: Rely on standard metrics like Accuracy, Precision, Recall, and F1-score, appropriately weighted for the real-world cost of errors.
Information Extraction: Focus on entity-level metrics with strict or relaxed span matching rather than token overlap.
Question Answering: Combine Exact Match, F1 score, BERTSCORE, and LLM-judge assessment of factual consistency [7, 8].
Code Generation: Evaluate functional correctness (unit tests), adherence to specifications (LLM-judge), efficiency, and code quality (linters).
Reasoning: Accuracy on specific reasoning benchmarks (e.g., mathematical problems, logical deduction tasks), evaluation of intermediate steps (Chain-of-Thought consistency) [1, 5], LLM-as-a-judge for logical soundness and factual consistency checks.
Comparing metrics against each other is crucial [8]. If coarse and fine-grained metrics don't track together across examples, it can highlight outliers or specific failure modes. Periodically check the correlation between different metric types for your specific task.
Reference-Based Metrics
If a reference or "gold standard" example of input and output exist then the quantitative measures of similarity can be known and simplify the evaluations. However, these comparisons often struggle with semantics and variations in expression—multiple correct answers or ways to summarize a text. Embedding models and LLM-as-judge can help if this is the case (as described below) [8].
When reference texts aren't available, several alternatives exist: (1) Use LLM-as-Judge approaches where a stronger model evaluates outputs based on criteria-specific rubrics (GEval is a versatile framework for deploying LLM-as-Judge) [1, 5, 9]; (2) Develop task-specific heuristics that check for required elements or constraints; (3) Implement self-consistency checks comparing multiple outputs from the same model with different sampling parameters; or (4) Create synthetic references using strong models, though these should be validated through human review. The most robust approach combines multiple evaluation methods to overcome the limitations of any single technique, creating a more comprehensive assessment framework even without traditional references. The key is recognizing that even without perfect references, structured evaluation criteria still yield valuable optimization signals.
PHASE 3: BEYOND BASIC METRICS: NUANCED PERFORMANCE ANALYSIS
Measuring Semantics
"Words don't mean; people mean." - S.I. Hayakawa
To measure the true meaning we have to move beyond surface-level text comparison. Semantic similarity measures the equivalence of groups of words through vector representations of language. This is a hard problem. Humans misinterpret even face to face spoken word with the extra context of body language and intonations. Measuring perfect semantic similarity is hard in NLP tasks but perfection is not required for it to be valuable [3].
Modern approaches to measure semantics leverage contextual embeddings that map text to high-dimensional vectors where cosine similarity measures conceptual closeness. Earlier embedding models like word2vec and GloVe have advanced to contextual embeddings like BERT, RoBERTa, or sentence transformers (There are now thousands of specialty trained task specific embedding models) [15]. When evaluating lengthy texts with multiple ideas, chunking becomes crucial. Chunking divides texts into manageable segments (sentences, paragraphs, or semantic units) [16]. Fine-grained sentence-level chunking captures detailed alignments but may miss broader themes, while paragraph-level chunks preserve more context but blur fine details. The final similarity score typically combines chunk-level scores through weighted averaging, with weights potentially adjusted to emphasize crucial sections. Thoughtful choice of embedding model and chunking can extract the necessary concepts desired for evaluation.
Metric Correlation and Pitfalls
"When a measure becomes a target it ceases to be a good metric." - Charles Goodhart
Several common pitfalls can undermine evaluation efforts. Perhaps the most frequent is over-reliance on a single metric (e.g., using only ROUGE for summarization) or using metrics inappropriate for the task's nuances (e.g., BLEU for code functionality) [5, 9]. Another danger is ignoring known metric limitations and biases. For example, n-gram metrics overlook semantic meaning, reference-based metrics depend heavily on reference quality, and LLM judges can exhibit positional bias, prefer verbosity, or be 'gamed' by models optimizing for the judge's preferences rather than true quality (Goodhart's Law). Moreover, focusing solely on average performance metrics might mask critical failures in worst-case scenarios, which could be crucial depending on the application's risk profile. Finally, it should be stressed, failing to correlate metrics with human judgment can lead you to optimize for the wrong things, and is why Phase 1 is so important.
Reasoning Evaluation
Evaluating intermediate reasoning steps (Chain-of-Thought) can provide rich evaluation signals, by evaluating the reasoning process and not just the outcome [7, 13]. Maintaining, and evaluating CoT traces allows for error localization and diagnosis, identify flawed logic, and recognition partial correctness. They are valuable in distillation and training smaller models. In SFT teaching the process is more effective than just showing final answers, it reduces the amount of data typically needed for fine-tuning or standard distillation [2]. That being said they are complex to evaluate and an active area of research in RL. LLM-as-a-Judge have been adapted to assess reasoning, checking logical flow and factual consistency. They provide value in guiding the model to better response and richer training data [1, 6].
Worst-Case Performance Assessment
"Primum non nocere." (First, do no harm.) - Hippocratic Oath
It is necessary to understand how the model performs in its worst cases as they often have a much greater impact on user trust and safety than average-case performance and can undermine the entire system. Conditional Value-at-Risk (CVaR) focuses on the average error in the worst percentile of outputs, quantifying the expected severity of major failures [10]. Unlike standard metrics that report mean performance across all samples, CVaR (also called Expected Shortfall) specifically targets tail risk by calculating the average loss within the worst-performing subset of examples, typically the bottom 5% or 10%.
CVaR is calculated by:
- Sorting all test examples by their error scores
- Selecting the worst α-fraction of examples
- Computing the mean error across this subset
Examining the best and worst samples has always provided valuable insight to me. By tracking CVaR alongside mean metrics, one can ensure that optimization efforts don't improve average performance at the expense of worst-case scenarios.
Adversarial Testing and Red-Teaming
Complementing statistical approaches like CVaR, adversarial testing deliberately probes for failure modes through systematic challenges designed to break the model. While not necessarily a set of scores to optimize, once failure modes are discovered they can be addressed. This involves:
Systematic Red-Teaming: Having skilled practitioners (or specialized models) deliberately craft inputs designed to provoke problematic outputs, exploring boundaries of performance.
Targeted Challenge Sets: Creating specialized test datasets focusing on known vulnerabilities or edge cases relevant to the specific task.
Perturbation Analysis: Introducing controlled variations to inputs (changing wording, adding irrelevant information, or introducing ambiguity) to test robustness.
Counterfactual Testing: Modifying key aspects of well-performing examples to identify which changes cause performance degradation.
Adversarial testing provides qualitative insights that purely statistical methods might miss, revealing specific failure patterns and vulnerabilities. When combined with CVaR, these methods provide a comprehensive understanding of worst-case performance, enabling targeted improvements to enhance model reliability in critical scenarios.
Synthetic Data Generation for Distillation: Key Considerations
When transitioning from evaluating model outputs to generating data for SFT or distillation, the quality threshold fundamentally shifts [13]. While evaluation accepts "adequately correct" responses, synthetic training data demands exemplary outputs that represent ideal performance. Training large language models on a smaller quantity of high-quality synthetic data can lead to better performance compared to training on a larger quantity of unvalidated data [5, 14]. These examples become the ceiling for what the distilled model can learn. Each synthetic example must not only be correct but optimal in its approach, reasoning, and format consistency [2].
Unlike test sets that might deliberately oversample edge cases, synthetic training data must match the expected production distribution to prevent distribution shift [5, 11, 12]. They also must maintain appropriate diversity without overrepresenting rare scenarios. And avoid introducing unintended biases or shortcuts that would be amplified through distillation.
A new layer of metrics becomes necessary to evaluate and filter the dataset as a whole:
- Dataset-level diversity measurements
- Coverage analysis of the problem space
- Consistency scores across similar examples
- Learning signal strength (how clearly the examples demonstrate the patterns to be learned)
- Counterfactual completeness (including both positive and negative examples)
The fundamental shift is that evaluation asks "Is this output good?" while synthetic data generation asks "Is this the ideal example to learn from?" The latter requires considering not just correctness, but learnability, generalizability, and how the example fits within the broader learning curriculum.
PHASE 4: HUMAN OVERSIGHT AND CONTINUOUS MONITORING
"The ultimate metric is user feedback." - adage
While the goal is often automation, human judgement remains the gold standard for validating LLM quality [8]. This is especially true for assessing nuanced aspects like creativity, genuine helpfulness, subtle biases, or alignment with complex human values.
LLMs and the data they process are constantly in flux. Input data drifts, models are updated, metrics evolve, and benchmarks saturate. Therefore, evaluation requires ongoing monitoring. Be prepared to recalibrate your metrics and evaluation criteria as the ecosystem changes and your understanding of the task deepens.
CONCLUSION: A COMPREHENSIVE APPROACH
Evaluating LLMs effectively, especially when optimizing them for specific tasks, requires a thoughtful, multi-faceted, and iterative approach. Starting with manual "vibe checks" and grounding the process in human judgment provides essential intuition. This should be complemented by a combination of traditional automated metrics and sophisticated LLM-as-a-Judge techniques, carefully selected and weighted based on task goals. By embracing this comprehensive methodology, we can better understand, optimize, and confidently deploy LLMs for specialized applications.
REFERENCES
-
Chang, Y., Wang, X., Wang, J., Wu, Y., Yang, L., Zhu, K., Chen, H., Yi, X., Wang, C., Wang, Y., Ye, W., Zhang, Y., Chang, Y., Yu, P. S., Yang, Q., & Xie, X. (2024). A Survey on Evaluation of Large Language Models. ACM Transactions on Intelligent Systems and Technology, 15(3), Article 39. [https://doi.org/10.1145/3641289]
-
Hsieh, C.-Y., Li, C.-L., Yeh, C.-K., Nakhost, H., Fujii, Y., Ratner, A., Krishna, R., Lee, C.-Y., & Pfister, T. (2023). Distilling Step-by-Step! Outperforming Larger Language Models with Less Training Data and Smaller Model Sizes. arXiv preprint arXiv:2305.02301. [https://arxiv.org/abs/2305.02301]
-
Khattab, O., Singhvi, A., Maheshwari, P., Zhang, Z., Santhanam, K., Vardhamanan, S., Haq, S., Sharma, A., Joshi, T. T., Moazam, H., Miller, H., Zaharia, M., & Potts, C. (2023). DSPy: Compiling Declarative Language Model Calls into Self-Improving Pipelines. arXiv preprint arXiv:2310.03714. [https://arxiv.org/abs/2310.03714]
-
Wang, Y., Ma, X., Zhang, G., Ni, Y., Chandra, A., Guo, S., Ren, W., Arulraj, A., He, X., Jiang, Z., Li, T., Ku, M., Wang, K., Zhuang, A., Fan, R., Yue, X., & Chen, W. (2024). MMLU-Pro: A More Robust and Challenging Multi-Task Language Understanding Benchmark. arXiv preprint arXiv:2406.01574 [cs.CL]. [https://arxiv.org/abs/2406.01574]
-
Wang, J., Yang, J., Li, H., Zhuang, H., Chen, C., & Zeng, Z. (2024). RewardDS: Privacy-Preserving Fine-Tuning for Large Language Models via Reward Driven Data Synthesis. arXiv preprint arXiv:2403.16953. [https://arxiv.org/abs/2403.16953]
-
Ma, Y., Qing, L., Liu, J., Kang, Y., Zhang, Y., Lu, W., Liu, X., & Cheng, Q. (2024). From Model-centered to Human-Centered: Revision Distance as a Metric for Text Evaluation in LLMs-based Applications. arXiv preprint arXiv:2310.07613. [https://arxiv.org/abs/2310.07613]
-
Le-Duc, K., Nguyen, K.-N., Tat, B. P., Le, D., Ngo, J., Vo-Dang, L., Nguyen, A. T., & Hy, T.-S. (2024). Sentiment Reasoning for Healthcare. arXiv preprint arXiv:2404.03367. [https://arxiv.org/abs/2404.03367]
-
Zhang, T., Kishore, V., Wu, F., Weinberger, K. Q., & Artzi, Y. (2020). BERTSCORE: Evaluating Text Generation with BERT. In International Conference on Learning Representations (ICLR). arXiv preprint arXiv:1904.09675. [https://arxiv.org/abs/1904.09675]
-
Zhang, Y., Jin, H., Meng, D., Wang, J., & Tan, J. (2024). A Comprehensive Survey on Automatic Text Summarization with Exploration of LLM-Based Methods. arXiv preprint arXiv:2403.14195. [https://arxiv.org/abs/2403.14195]
-
Chaudhary, S., Dinesha, U., Kalathil, D., & Shakkottai, S. (2024). Risk-Averse Fine-tuning of Large Language Models. Accepted to International Conference on Learning Representations (ICLR) 2025. Available on OpenReview.
-
Hashimoto, T. B., Srivastava, M., Namkoong, H., & Liang, P. (2018). Fairness Without Demographics in Repeated Loss Minimization. In Proceedings of the 35th International Conference on Machine Learning (ICML) (pp. 1929-1938). PMLR. [http://proceedings.mlr.press/v80/hashimoto18a.html]
-
Duchi, J. C., & Namkoong, H. (2018). Learning models with uniform performance via distributionally robust optimization. arXiv preprint arXiv:1810.08750. [https://arxiv.org/abs/1810.08750]
-
Shirgaonkar, A., Pandey, N., Abay, N. C., Aktas, T., & Aski, V. (2024). KNOWLEDGE DISTILLATION USING FRONTIER OPEN-SOURCE LLMS: GENERALIZABILITY AND THE ROLE OF SYNTHETIC DATA. arXiv preprint arXiv:2403.14164. [https://arxiv.org/abs/2403.14164]
-
Iskander, S., Cohen, N., Karnin, Z., Shapira, O., & Tolmach, S. (2024). Quality Matters: Evaluating Synthetic Data for Tool-Using LLMs. arXiv preprint arXiv:2409.16341. [https://arxiv.org/abs/2409.16341]
-
Warner, B., Chaffin, A., Clavié, B., Weller, O., Hallström, O., Taghadouini, S., Gallagher, A., Biswas, R., Ladhak, F., Aarsens, T., Cooper, N., Adams, G., Howard, J., & Poli, I. (2024). Smarter, Better, Faster, Longer: A Modern Bidirectional Encoder for Fast, Memory Efficient, and Long Context Finetuning and Inference. arXiv preprint arXiv:2412.13663. [https://arxiv.org/abs/2412.13663]
-
Schwaber-Cohen, R. (2023, June 30). Chunking strategies for LLM applications. Pinecone. [https://pinecone.io/learn/chunking-strategies/]